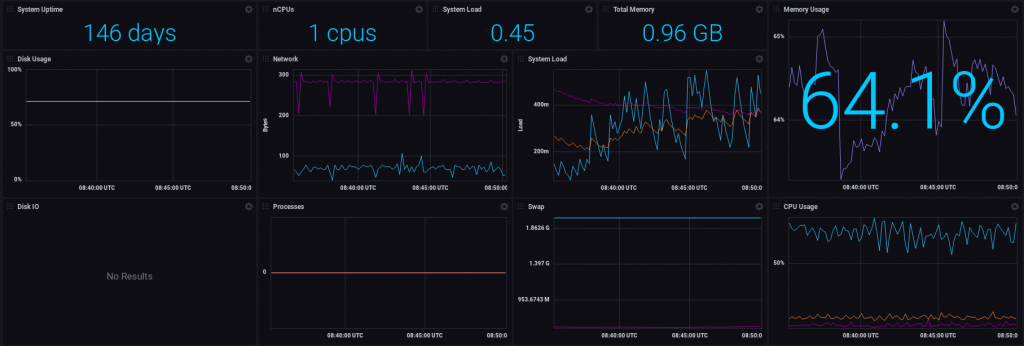
I’ve had most of my stuff running a k3s “cluster” for the past half a year or so. The whole setup runs on a single $5-a-month Digital Ocean droplet with 1vCPU and 1GB of memory.

Needless to say, it doesn’t take much to bring the whole thing to its knees. While it has no issues dealing with the little traffic my blog receives, I would accidentally bring it down occasionally when I install a Helm chart that turned out to be much heavier than I’d thought.
One such is the WordPress chart which seems to run some form of npm install when it starts up, murdering the poor node. Working from that chart and using the official WP image instead of what Bitnami cooked up solved that problem (since you’re reading this), but I learned a painful lesson. (I’m planning to make a public repo with the manifests that power the site, but I’ll have to figure out how to deal with secrets first.)
That was one of the reasons I’d hesitate to dump a full-fledged monitoring solution into the mix. While I really like how pretty Grafana is, I wasn’t sure at all my node could handle running a monitoring setup watching everything. Also, I’d wanted to try out the TICK (Telegraf – InfluxDB – Chronograf – Kapacitor) stack from InfluxDB, but that was definitely out of question.
That is, until I found out about their free cloud offering. While running the whole setup would’ve been too much (both resources-wise and to maintain), just putting a Telegraf image on the cluster should be fine. Then that could send whatever metrics I’d like to see to the cloud where it wasn’t my little droplet sweating to run analytics on it.

Setting it up was a bit trickier than I’d hoped. InfluxDB Cloud “helps” with generating a Telegraf config file, but its format can’t be just fed into the Telegraf Helm chart. The templates to choose from are definitely useful, but it takes a bit of tweaking to work with Helm.
Sadly the disk IO metrics don’t work, but I’m lazy to fix that at the moment. (I kinda expected it too, since Telegraf is running inside a container.)

Setting up alerting was trivial too. InfluxDB Cloud can send Slack webhooks “out of the box,” and getting it to work only takes creating a check and the alert based on that. Luckily it’s been silent since I set it to the live values, and I hope it’s gonna stay that way…
