And I’m not talking about the meme with the guy in the corner thinking “they have no idea.” I’ve been playing around with k0s again, trying out alternative runtime and network plugins. It of course has to be dual-stack in 2026, but that’s where I ran into some unexpected problems.
Rescuing broken MariaDB
As usual, my cluster is limited in resources (what you get for using the cheapest VPS available, I guess). Recently for whatever reason, one of my nodes has been constantly getting high IO and CPU warnings. As usual, this was caused by high swap activity due to memory exhaustion. The thing is, I didn’t really understand why that would suddenly start to happen.
Things (which may or may not be detailed in a later post) happened and I ended up wanting to migrate the MariaDB powering this blog to a different node. This is when all hell broke loose.
CoreDNS going MIA
I ran into a really weird problem today. I noticed some strange config drift on one of my nodes (shit happens when I manually experiment in “production”), so I decided to reinstall/upgrade the k3s agent. For a while now I’ve been connecting my nodes through tailscale, so that I can have my homelab machine join the cluster from my home network as well. k3s has a(n experimental) feature for “natively” integrating with tailscale and it’s been working just fine so far.
Fixed my TLS

Usually there was no problem. Stuff worked just fine. Certificates were generated and renewed automatically. https:// links opened without ugly browser warnings about how you’re about to get hacked and it’s the end of the known universe.
But when it wasn’t “usually”, when Traefik just happened to restart for whatever reason, then all of that was obliterated. Since Traefik was running on ephemeral storage, eg nothing was really persisted, innocently tweaking some configuration (that resulted in a restart) could be catastrophic. You know, self-signed certificates and ugly browser warnings.
Upgrading the argo-cd Helm chart from 5.x to 8.x

I’ve been using Argo CD for GitOps automation for a very long time. I have it manage itself too! The other day I noticed that there was a new major version of Argo CD, so I decided to upgrade my stuff too. It did not go smoothly, though it wasn’t an issue with Argo CD itself.
It was the usual problem of Helm charts renaming and moving around stuff in their values.yaml, which results in significant breakage for (from an user perspective) no good reason. I summed up what I learned so others don’t have to play around with it so much.
The mythical modular monolith

So often I see people giving talks about how the microservice architecture is a failure. You end up losing transactional protections, you’ll have to “join” data across a network boundary, and that network boundary is “always” flaky. Wouldn’t it be much better if everything was in one process, where you could enjoy the benefits of transactions, neighboring data is just a method call away and the only network you have to worry about is the database connection?
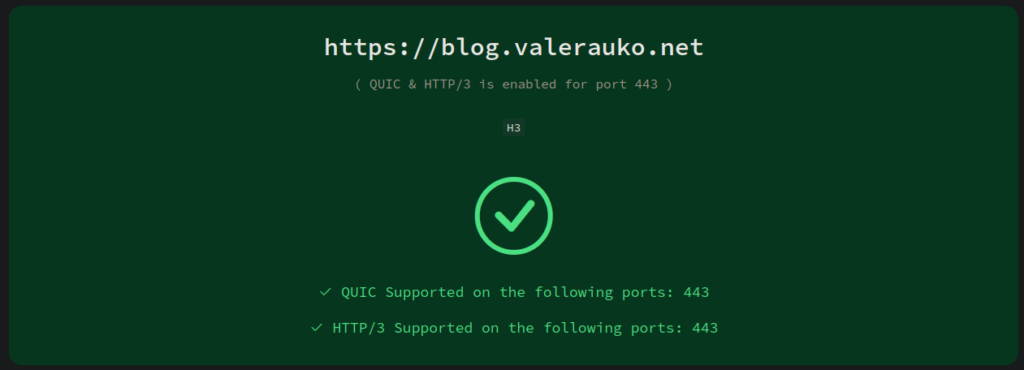
Why isn’t my HTTP/3 working?
On a sudden impulse, today I updated the Traefik in my cluster to v3. Unlike the transition from v1 to v2, v2 to v3 was very smooth. I only needed a few tiny tweaks to the configuration. One of those was that HTTP/3 support is no longer “experimental” and so it shouldn’t be configured as such. This started me on a weird quest on getting my sites to use H3.
Longhorn trash weighing me down
Last year I gave Longhorn a try. It was a nice proposition for me: I was using local storage anyway, so the idea that pods would be independent of the nodes sounded delicious. Except the price was way too much.
At the time I thought that the only problem was Prometheus, which in itself is pretty heavy on disk IO, but it turns out the issue was with Longhorn itself. Also, as I found out, I wasn’t thorough enough deleting Longhorn stuff, which resulted in quite a few headaches this year.

Setting up additional container runtimes
The other day I noticed a post on one of my Misskey Antennas about “a container runtime written in Rust” called youki. This piqued my interest especially since its repository is under the containers org, which is also the home of Podman and crun for example. I’ll be honest and admit that I’m still not very clear about the exact responsibilities of such a runtime. It gets especially fuzzy when both “high level” runtimes like containerd and docker, and low level runtimes (that can serve as the “backend” of high level ones) like kata and youki are referred to just as “runtimes.” Anyway I decided to give it a try and see if I could get it to work with my k3s setup. It really wasn’t as easy as I’d hoped.
Adding Grafana annotations based on Flux CD events
Earlier this year I wrote about adding Grafana annotations based on Argo CD events. Since this year I actually got around testing out Flux some more, it was natural to follow up with adding some Grafana annotations based on Flux events.