Tag: observability

Telegraf on Kubernetes with InfluxDB Cloud

I’ve had most of my stuff running a k3s “cluster” for the past half a year or so. The whole setup runs on a single $5-a-month Digital Ocean droplet with 1vCPU and 1GB of memory.

Needless to say, it doesn’t take much to bring the whole thing to its knees. While it has no issues dealing with the little traffic my blog receives, I would accidentally bring it down occasionally when I install a Helm chart that turned out to be much heavier than I’d thought.

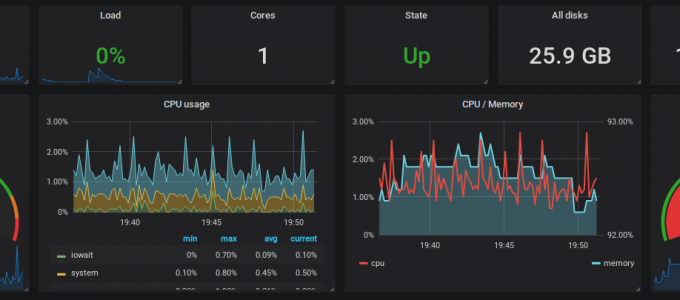
Getting that system dashboard working

Earlier I wrote about how I set up Beats – Elasticsearch – Grafana to visualize the various metrics (and logs, hate me) from Kitsune‘s dev server. There were a few tricky spots that didn’t work at first and took a while to figure out (or at least get working).


分散型SNSの可視化

前回は何を使って可視化しようかなと悩んでいろいろと試して比較したが、そのあと実際に形にしたので、今はこういったダッシュボードがいつでも眺められる。

System metrics dashboard

手軽に可視化したい

ここしばらくは空いてる時間でキツネという分散型SNSを開発している。分散型SNSは一台のサーバーで完結せず、ActivityPubやOStatusといったプロトコルでいろんなサービス(Mastodon, Pleromaなど)とのサーバー間の通信も重要。

本番に上がって使ってもらう時はもちろん、現状の開発中でもログは不可欠。バグがもしあった時に、いちいちデバグ文をあちこちに入れて何とか原因を突き詰める作業をできるだけ減らしたい。俺に考えつくのは、例えばリクエストや処理が失敗したとしても、初段の調査に最低限必要な情報は既にログにあるようにしたい。