
I’ve been building a Netty-based web server in Clojure. While I haven’t had the strength to do much with it these past few months because I prioritized the climbing season, now that Hacktoberfest is incoming I’m planning to go pedal to the metal with it (and with my git GUI work-in-progress).
I’m building iny (named after a fox from Fekete Istvan’s Vuk) with the clear goal to replace Aleph. While I’m a huge fan of Aleph and the libraries around it (like Manifold) it’s no longer maintained, which is simply not acceptable when we’re now looking at http/3 coming out sooner than later (support is already in browsers after all).
That also means I have the obvious goal that it should be at least as fast as Aleph in “hot path” use cases. I plan to use it as the web server to drive the backend of kitsune and other (possibly work) projects as well. I’m also comparing it against pohjavirta, Metosin’s new Undertow-based server.
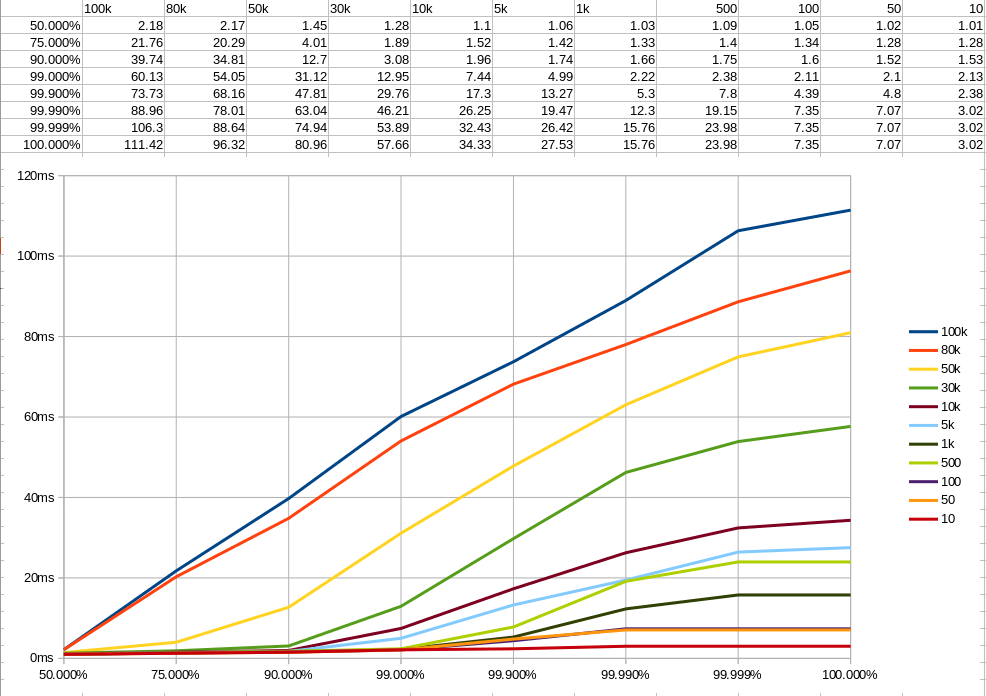
Benchmarking proved to be quite a rabbit hole. It’s surprisingly not trivial what and how you’re supposed to benchmark. I’ve been using both wrk and wrk2 to benchmark performance and naturally the results vary wildly. They look at different numbers and work differently (wrk ignoring queue time and wrk2 using constant throughput), so it’s great that I have other projects to compare to. This way I don’t have to figure out which benchmark is “right” – I can just compare how other projects perform with the same benchmark.
This is the first time I deal with such a performance-sensitive thing. When I’m aiming for consistent sub-millisecond response times, every single assignment and iteration count. Personally I prefer looking at wrk because the numbers are much lower and I can feel more in control. With wrk2 it turns into more black magic thinking about how the hell can I do something about the back-pressure. But in the end it’s the same: get fast. Then get faster.
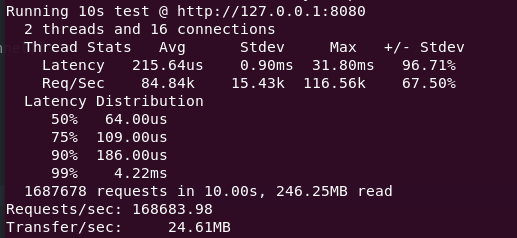
Of course having a 90%ile of under 200 nanosec is really nice, but then I still need to look at the standard deviation of almost a whole millisec which definitely does not look good. Controlling the deviation comes down to looking at how many threads are doing what where and resolve blocking or waiting situations that unnecessarily hold back other requests. This means tricks like moving as many objects to static scope as possible so they don’t have to be initialized every single request (which is a lot of time and memory).
I also spend lots of time looking at flame graphs trying to figure out what else could I optimize. I really like flame graphs for how easy they are to use and how “clearly” they show bottlenecks. Even with massive amounts of Java interop (hell it’s mostly Java interop) from Clojure, it’s surprisingly not so hard to find the culprits.