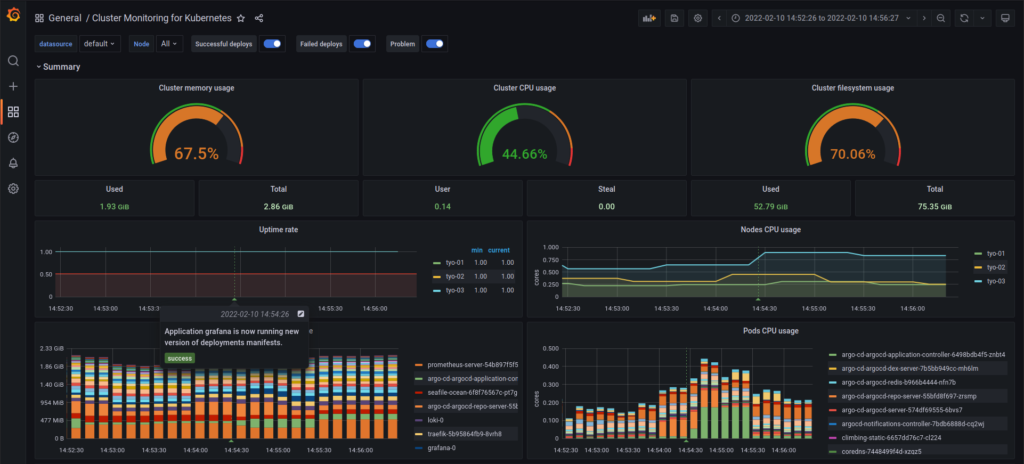
I was thinking about how nice it would be if I could see on my main Grafana dashboard (the only one I use at this point actually) when there are new versions of something deployed. This way if by chance there is a problem with something afterwards I can see at a glance what could have gone wrong. Also I really like just looking at that Grafana dashboard and see that everything is alive and well. (Except when it isn’t.)

Getting there wasn’t as trivial as the Argo Notifications docs make it sound. (As usual, I must say: Argo’s docs about declaratively setting up stuff are just not up to date, let alone its “community maintained” Helm charts.) It turns out Argo Notifications as a whole is no longer maintained as a separate thing and was “merged” into Argo CD (though it seems to be just replaced by the notifications-engine library). I noticed this after I added the Helm chart to my cluster though, so I don’t know if this can be set up through the Argo CD chart directly now.
Anyway, the problem for me was that I assumed different defaults than what the chart provided. (Why is it always my own failed assumptions that cause me so much suffering?) I thought that the default templates and triggers would be around and I can just turn them on by using enabled: true and setting up subscriptions with the Grafana notifier. No.
There seem to be no (working) defaults, so the triggers and templates need to be uncommented in the values.yaml and adjusted to the user’s (my) needs. Figuring that out took so long because Grafana doesn’t log annotation requests even at debug level, so I had to pop a debugger pod in the cluster, make Argo “notify” that and see what could be wrong with the request. That’s how I noticed that the request’s text field for the annotation was empty, which Grafana rejected (silently).
It took a few hours to figure out what was wrong, but I got it working in the end as can be seen in my manifest. Tons of thanks for mendhak’s HTTP request debugger Docker image, saved me from making my own.
