Earlier this year I wrote about adding Grafana annotations based on Argo CD events. Since this year I actually got around testing out Flux some more, it was natural to follow up with adding some Grafana annotations based on Flux events.

Earlier this year I wrote about adding Grafana annotations based on Argo CD events. Since this year I actually got around testing out Flux some more, it was natural to follow up with adding some Grafana annotations based on Flux events.
When you create a whole FluxCD new setup from zero, it’s really easy: use flux bootstrap. it does “everything” for you. In my case I tried this setup first for last year’s advent calendar. Except back then I had an expedition scheduled for the first half of December, so this took the back seat and was eventually forgotten. Therefore in this year past everything I did back then slowly sank into oblivion, so I again had to start pretty much from zero.

I did set up the repo and a cluster (on Civo) back then, but I quickly tore down the cluster when I realized I wouldn’t be able to test it all out. The repo stayed though, so now i was starting afresh with a k3s cluster spanning three nanodes (that’s a linode referral link with a $100 credit over 60 days) and a repository already set up from last year.
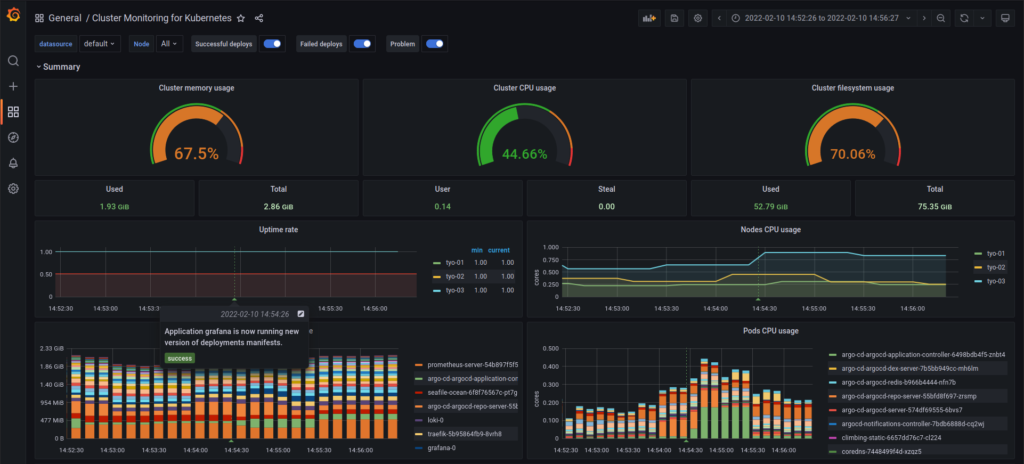
I was thinking about how nice it would be if I could see on my main Grafana dashboard (the only one I use at this point actually) when there are new versions of something deployed. This way if by chance there is a problem with something afterwards I can see at a glance what could have gone wrong. Also I really like just looking at that Grafana dashboard and see that everything is alive and well. (Except when it isn’t.)
It’s been a year since I wrote about bootstrapping a cluster with Argo and using Argo Rollouts for canary deploys based on Prometheus metrics. Since then many things have changed. I moved from Digital Ocean to Linode (mostly because Linode has a Tokyo region) and from a single-node k3s “cluster” to a 4-node one. But most of how I use Argo CD for GitOps hasn’t changed.


I wish it could be completely automated… But for now I’ve just automated as much as possible (and convenient). The ingredients:
I have a repository for the purposes of playing around with Kubernetes tooling like this – and hopefully turn it into an actual application eventually. I have big plans and lots of stuff I want to try out, but time is limited. All the code examples in this post use the namespaces and naming choices in the repository. The folder structure (relevant to this bit) is like…
system
 ├┬ apps
 │└─ (bootstrapped Argo CD app manifests)
 ├┬ argo
 │└─ the local "umbrella chart" for Argo CD and Argo Rollouts
 ├┬ bootstrap
 │└─ boilerplate project and application manifests
 └┬ manifests
  └─ manifests I didn't bother turning into a Helm chart
     referenced by the raw-manifests.yaml application
アプリコードを変えました。後は機械がなんとかするはずのところ、そこから何十分もかかる手動のデプロイ作業が待っていた。アプリが動く台が増えるとその時間も台数の分だけ倍増する。
理想は、コードの変更がgit上で主ブランチにコミットとして現れたら、CI/CDパイプラインがコンテナイメージを生成して(マージ前にすでにテストが通っている前提)本番環境にカナリヤの方式でデプロイされる。