Earlier this year I wrote about adding Grafana annotations based on Argo CD events. Since this year I actually got around testing out Flux some more, it was natural to follow up with adding some Grafana annotations based on Flux events.

First there needs to be a Grafana instance though, so I went on to install my “usual” suite of Grafana, metrics-server, Prometheus and Loki to my Flux playground cluster. For a change I actually managed to get my favorite Grafana dashboard imported on install. Before I’d always mess up somewhere and have to install it manually afterwards, so this was a refreshing change.
One prerequisite is that if Grafana has authentication enabled (which it does by default), a Secret has to be made for Flux to use for authentication. And for that an API token has to be made in Grafana. Except now “just” API tokens aren’t recommended and it suggest we use service accounts instead. Considering this is already how it works in Kubernetes, it feels natural. But this doesn’t make creating an API token much more complicated: make a service account for Flux and then create a token for it.
There are three options for the service account’s authority level: admin, editor or viewer.
Once the service account and token are good to go, make the Kubernetes Secret however you manage Secrets. SealedSecrets, Hashi Vault, just good old plain text, whatever. Since I don’t intend for this cluster to be particularly long-lived, it’s a playground and I definitely don’t feel like adding a component for managing secrets, I just committed it to git straight (not to mention that the Grafana it authenticates to isn’t even exposed to the internet). This is how I made it (hint: following the docs):
kubectl --context flux -n grafana create secret generic flux-token \
--from-literal=token=$TOKEN \
--from-literal=address=http://grafana.grafana.svc.cluster.local/api/annotations \
--dry-run=client -o yaml > secret.yaml
Note: don’t use https unless you actually set it up to work inside your cluster, or the annotation requests will just time out (and they aren’t retried). Also don’t forget the /api/annotations or you’ll get the whole Grafana 404 HTML page in your notification controller logs.
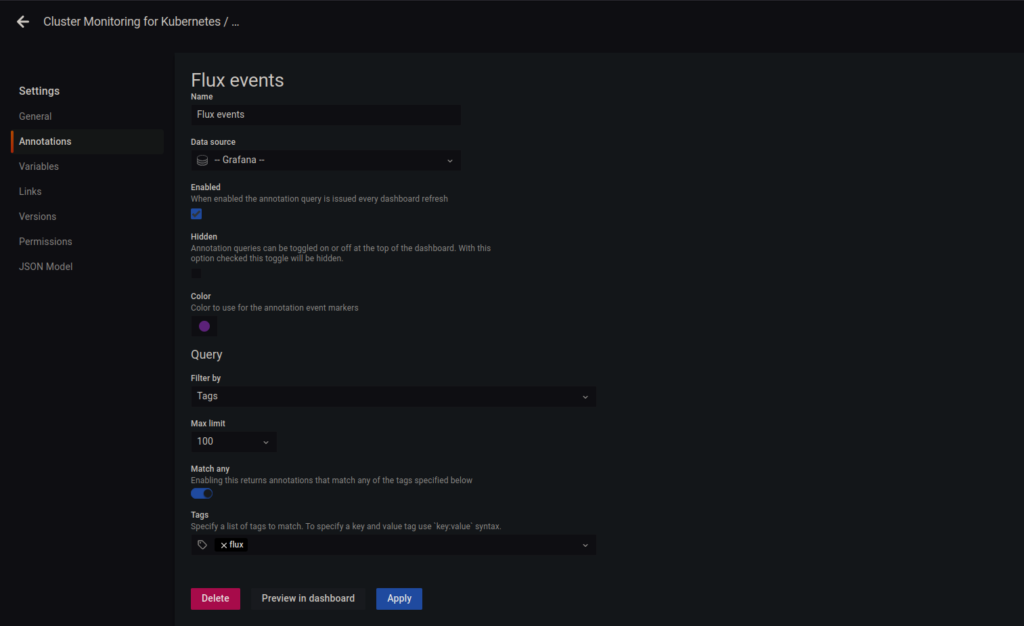
Then I added a Provider spec following the docs as well and I was ready to roll. I then added annotations to the dashboard with the suggested “Match any” filtering by tags for “flux”. This is where things got really interesting. After all, you’d want to test if the annotations actually showed up, right? But finding something that is supposed to trigger them wasn’t trivial. Or rather: I wasn’t sure if what I was doing was supposed to send a notification at all, or did I screw up the setup?
Turns out the problem was both. First, I didn’t create any Flux Alert objects that define what events about what objects should be sent as notifications. Using kubectl logs I could check what the notification controller was doing, and it hinted me off with “Discarding event, no alerts found for the involved object.” Second, I created the service account’s token as a Viewer, and that apparently persisted even after changing its permissions to Editor (which is needed to create Annotations). Third, I clicked the wrong boxes so instead having the annotation Enabled and not Hidden, I had it not Enabled and Hidden instead. Sanity checks are important.
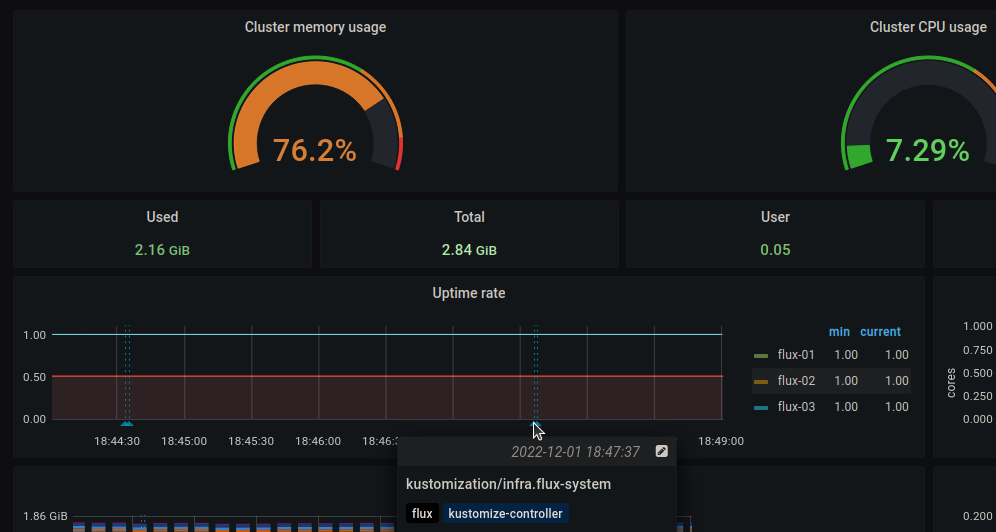
Once I got the actual annotation events flowing in, it was clear that while “flux” is a good catch-all tag, it might be a bit too much. While it doesn’t create annotations on every sync, depending on the Alert configurations it can still be quite a lot (for example getting a notification both for the GitRepository sync and the following Kustomization reconciliation). However the annotations come with a bunch of tags such as “source-controller” or the git commit id, so there are plenty of ways to tweak it to one’s needs. While I couldn’t find a way to add custom tags, it is possible to add a custom description to each annotation by adding a summary to the Alert spec. If all else fails annotations can manually be edited from Grafana too.